JIRA Dashboard provides a customizable, real-time view of your team’s progress. It allows team members to manage their day-to-day operations from a single, accessible screen. To start creating your JIRA dashboard, you first need to have a JIRA account and access to the JIRA software. Once you have access, follow these steps:
- Create a new dashboard: From your JIRA home screen, click on the Dashboards link in the top menu bar, and then click Create Dashboard. Dashboards > Manage Dashboards > Create New Dashboard
- Choose a name and layout: Give your new dashboard a name and choose a layout that works best for your team. You can select from a variety of pre-built templates or create a custom layout.
- Add gadgets: Gadgets are the building blocks of your dashboard. They display specific information, such as project progress, issue status, or team workload, they are the individual components. To add a gadget, click on the Add Gadget button and select the one you want to use.
- Configure your gadgets: Once you have added them, you can customize them to display the most relevant information to your team. You can adjust the filters, fields, and other settings to display the data you need.
- Save your dashboard: Once you have set up your dashboard, save it so that you and your team can access it at any time. You can also share your dashboard with others by granting them access to view it.
By creating a JIRA dashboard, you can easily monitor the progress of your projects and ensure that everyone on your team is on the same page. With a little customization, you can create a powerful tool that helps you stay on top of your work and make informed decisions.
Advantages of JIRA Dashboard
There are several advantages of using a JIRA dashboard for project management:
- Real-time visibility: JIRA dashboards provide a real-time view of your team’s progress, giving you instant visibility into the status of your projects and the work being done.
- Customizable: JIRA dashboards are highly customizable, allowing you to tailor them to your team’s specific needs and preferences. You can choose the layout, gadgets, and filters that work best for you.
- Centralized information: By consolidating all project information in one place, JIRA dashboards help ensure that everyone on your team is working from the same page, with the same data and insights.
- Improved collaboration: JIRA dashboards can be shared with your team and other stakeholders, facilitating better collaboration and communication across the project.
- Easy reporting: JIRA dashboards make it easy to generate reports and metrics, giving you valuable insights into your team’s performance and helping you make data-driven decisions.
- Better decision-making: With a JIRA dashboard, you can quickly identify roadblocks, prioritize tasks, and adjust resources as needed, enabling you to make better, more informed decisions about your project.
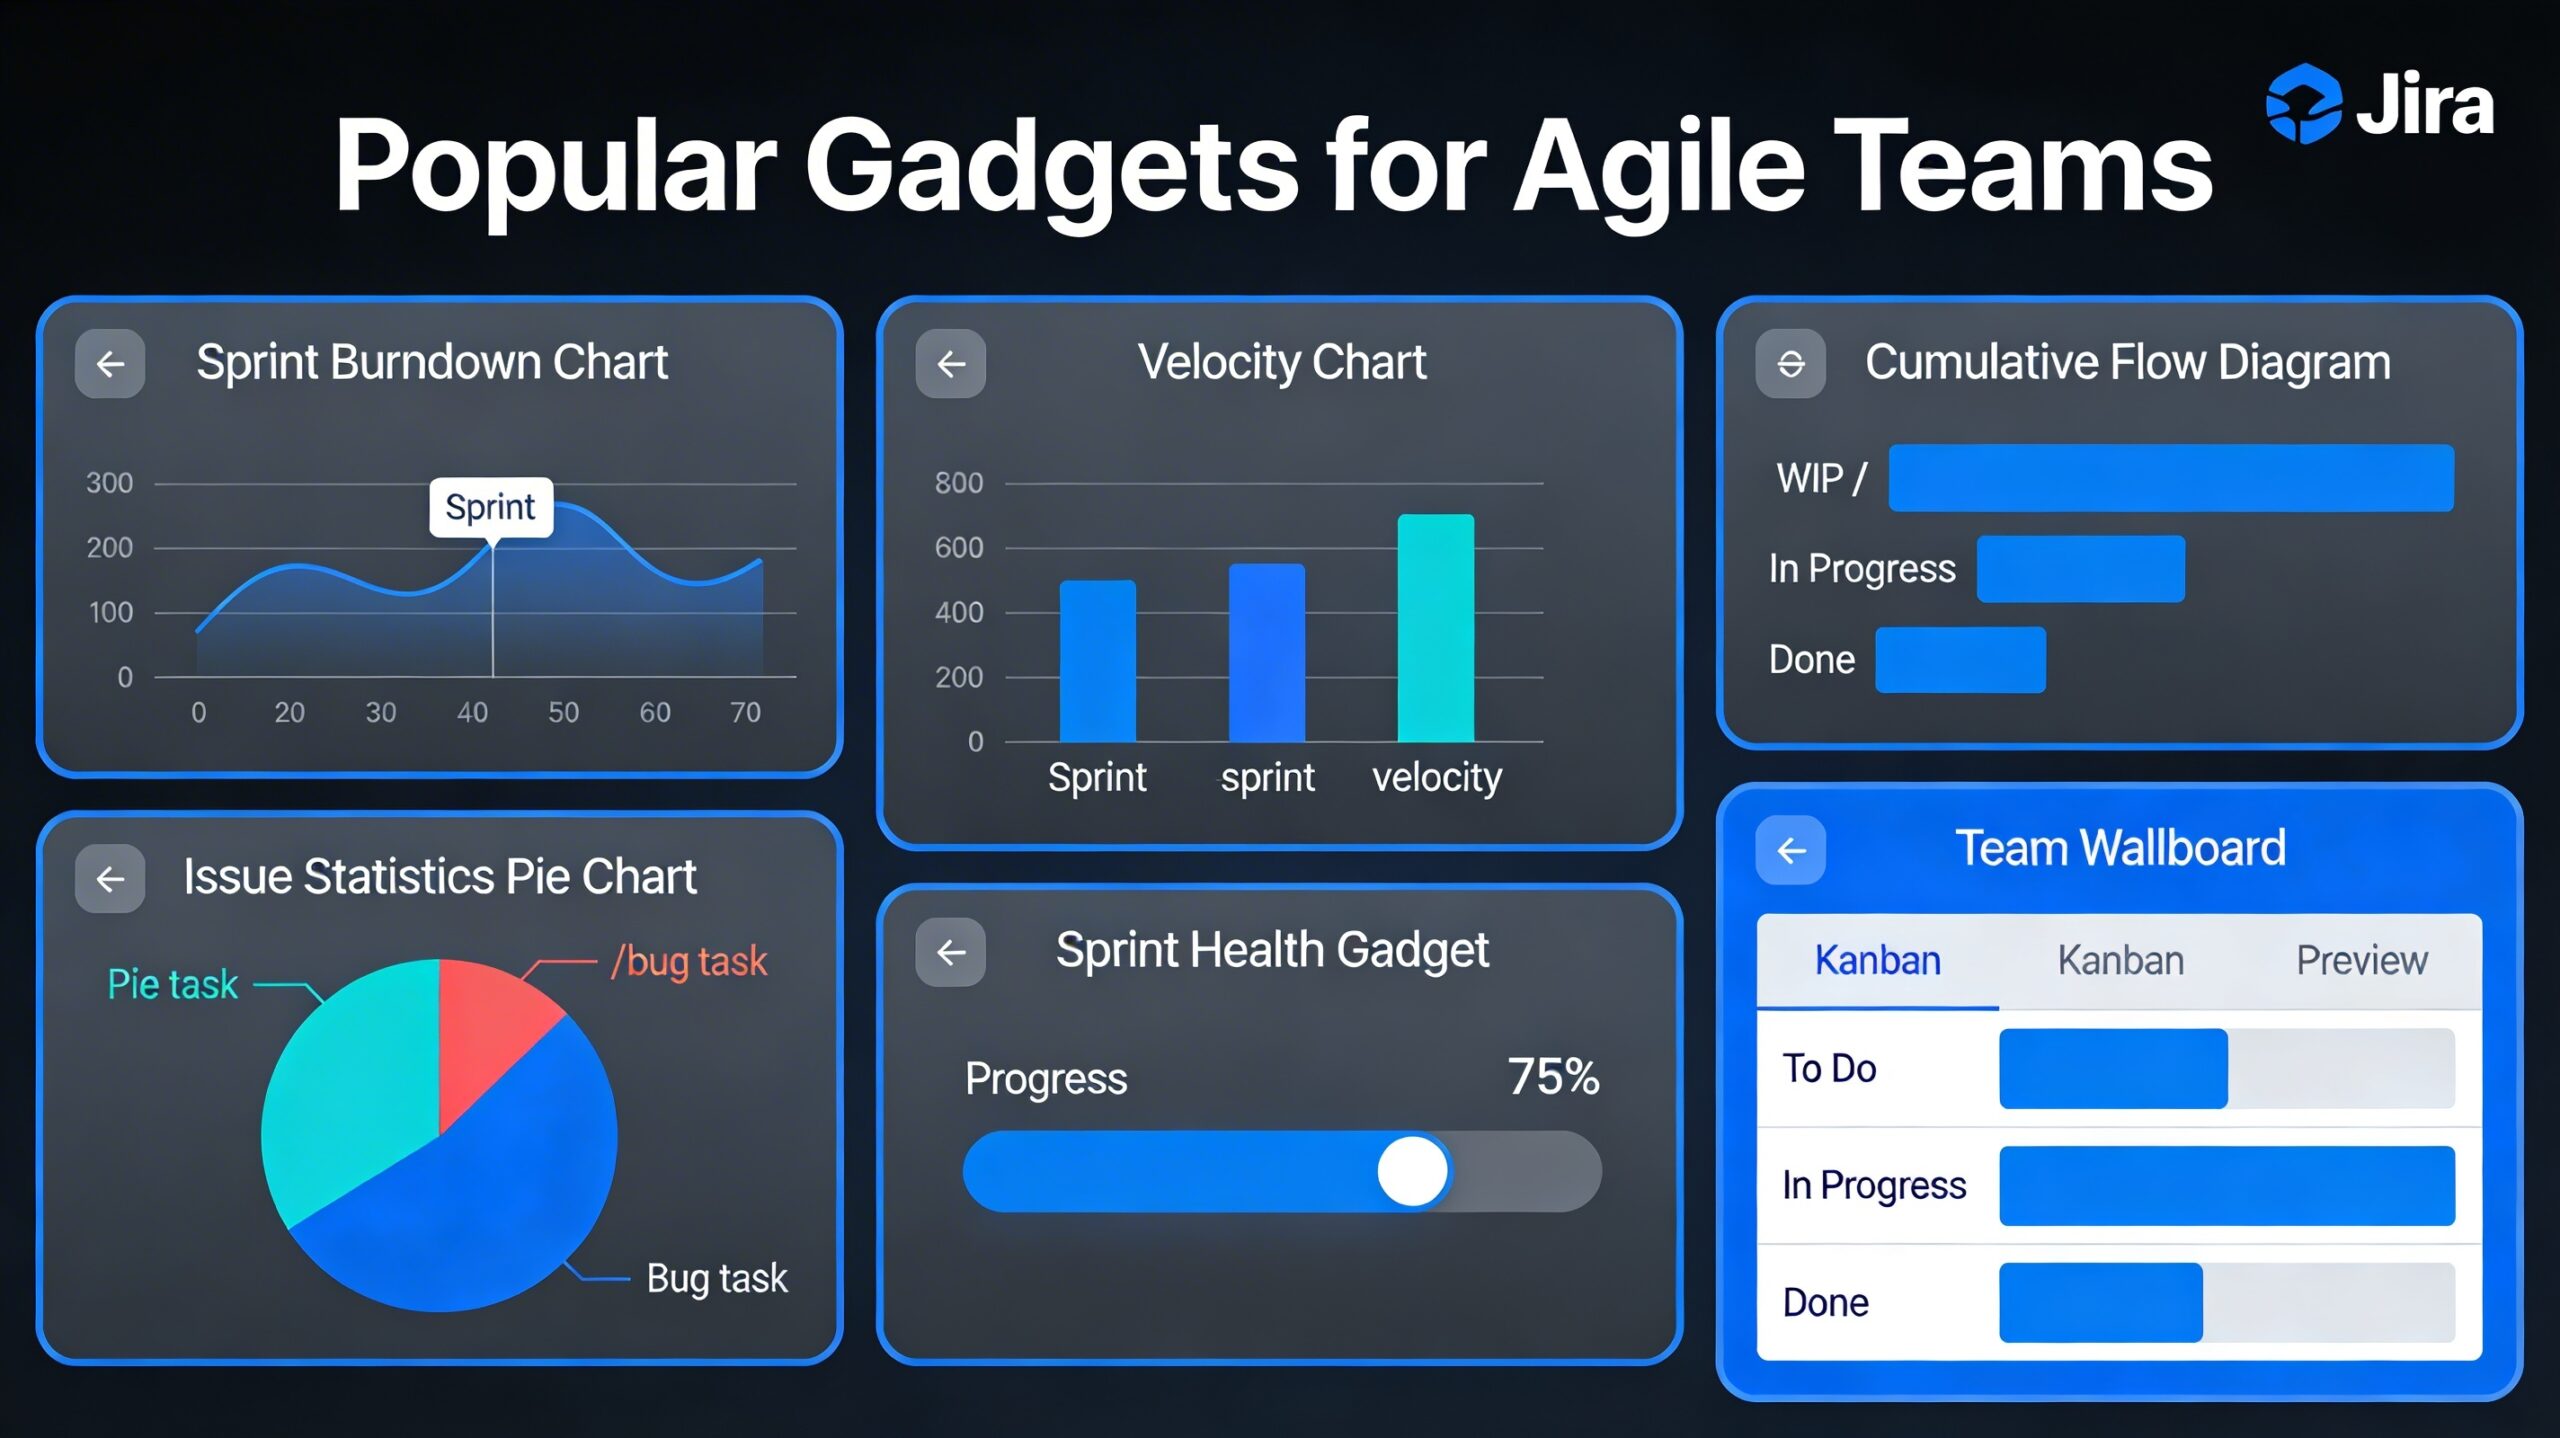
Popular JIRA Dashboard Gadgets
JIRA Dashboard Gadgets allow you to interact with your content directly on the Jira Dashboards. Jira Dashboard Gadgets are a small application that displays an overview of data using various filters. Jira also offers its users the option to customize the Jira Dashboard Gadgets to suit their specific needs. To add new Jira Dashboard Gadgets, click on the Add Gadget button at the top of the Dashboard. Here are a few categories and popular gadgets
- Jira Gadgets for Sprint Health and Statistics: Sprint Health Gadget & Filter Results Gadget
- Jira Gadgets for Tracking Progress: Road Map Gadget, Created vs. Resolved Gadget & Two Dimensional Filter Statistics Gadget
- Jira Gadgets for Understanding Workload: Pie Chart and Average Age Chart
- Jira Gadgets for Status and Watched Items: Issue Statistics Gadget, Watched Items Gadget
Sprint Health Gadget
The Sprint Health Gadget displays a color-coded bar graph showing a concise summary of the issues in a specified sprint. The Sprint Health Gadget in JIRA has several advantages, including:
- Provides a visual representation of the health of a sprint, allowing team members to quickly identify any issues or areas of concern.
- Enables team members to see the progress of individual tasks and the overall sprint, helping them to stay on track and meet their goals.
- Allows for easy customization and filtering, so team members can view the most relevant data to their needs.
- Provides a shared visual representation of the sprint’s progress, helping team members stay aligned and focused on the sprint’s goals.
- Offers a way to quickly identify any tasks that are falling behind schedule, allowing team members to take proactive steps to keep the sprint on the track.
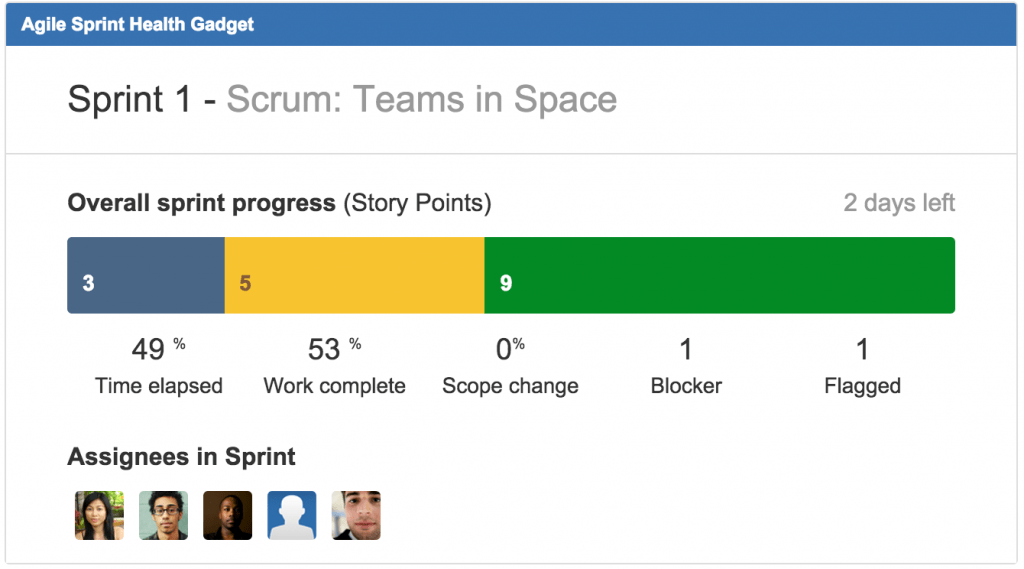
The gadget also displays other handy information about the progress of the sprint and participants in the sprint.
| Field | Description |
| Overall sprint progress bar | The blue, yellow, and green colors of this bar represent different issues in different statuses. These colors match the blue, yellow, and green columns in the column configuration for your board, where each column has different statuses mapped to it. Click any part of the bar to view the issues in the corresponding statuses. |
| Time elapsed | The time elapsed since the sprint started. |
| Work complete | This is calculated based on the estimation statistic used for your board. This is reflected by the green part of the progress bar. For example, if you have 50 story points in a sprint and you have 3 issues with 10 story points that have been resolved, the ‘Work complete’ will be 20% (i.e. 10 out of 50 story points). Note, the Sprint Health gadget will not reflect the progress from work logged in the ‘Remaining Estimate’ and ‘Time Spent’ fields in JIRA if you have your board configured to use that data. |
| Scope change | Adding or removing an issue from a sprint, after it has started is considered a change of scope. The percentage is calculated using the statistic that is configured for the board (see Configuring Estimation and Tracking). For example, if you started a sprint with 50 story points and add an issue with 5 story points, the Sprint Health gadget would show a 10% scope change. If you add/remove issues that don’t have estimates, the scope change will not be altered. If you’re using Time Tracking, Scope Change will not be shown. |
| Blockers | This field counts all blockers that are in ‘To Do’ or ‘In Progress’ in JIRA Agile. A blocker is evaluated as the highest priority level defined in your JIRA instance. See Defining ‘Priority’ Field Values. |
| Flagged | This field counts all issues that have been flagged. |
How to Create a Sprint Health Gadget on Jira Dashboard
- Log in to JIRA or navigate to your dashboard.
- Click the Add Gadget link in the top right. The Gadget Directory screen will display.
- Find the JIRA Agile Sprint Health gadget in the list of gadgets and click Add it now.
- Click the Finished button in the bottom right.
- The JIRA Agile Sprint Health Gadget gadget will display on your dashboard. Enter the following setup details for your gadget:
- Board — this will display all boards
- Sprint — this will list all active sprints
- Refresh Interval — choose how often the data in the gadget will refresh.
- Enable all three options underneath so assignees, sprint name, and board name are always visible
- Use the Next Sprint Due (auto) option for Sprint so you don’t have to update the gadget’s settings every sprint
- Click the Save button. The JIRA Agile Sprint Health Gadget will display on your dashboard.
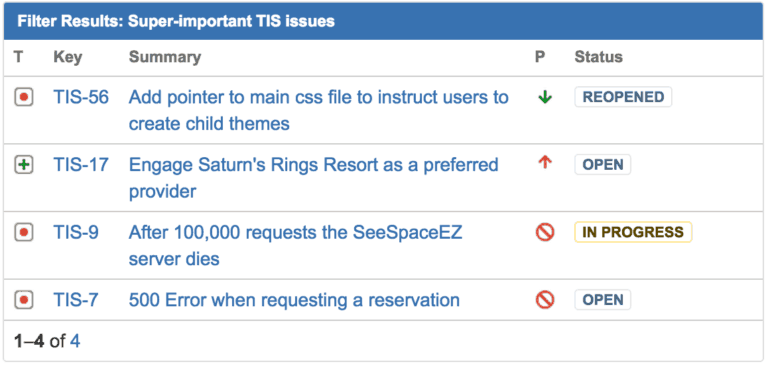
Filter Results Gadget
The Filter Results Gadget is a useful tool within JIRA that allows users to create custom filters to display specific information on a JIRA dashboard. It can be configured to display a maximum number of issues from the collection returned from the specified filter. By utilizing this gadget, teams can quickly and easily view the status of their projects and track their progress in real-time.
Adding the ‘Filter Results’ Gadget to your Dashboard
- Go to your JIRA dashboard and click Add Gadget.
- The Gadget Directory will appear. Locate the Filter Results gadget and click the Add it Now button. Then click the Finished button at the bottom of the Gadget Directory.
- The Filter Results gadget will appear on your dashboard as follows:
- Saved Filter — start typing the name of the filter, or click the Advanced Search link to search for a filter/select one of your favorite filters/select a filter that you have created.
- Number of Results — type the maximum number of issues that you want the gadget to display per page.
- Fields to display — select the issue fields to display as columns. Drag and drop to re-order.
- Refresh Interval — select how often you want the gadget to update the displayed activity (never / every 15 minutes / every 30 minutes / every hour / every two hours).
- Click the Save button.
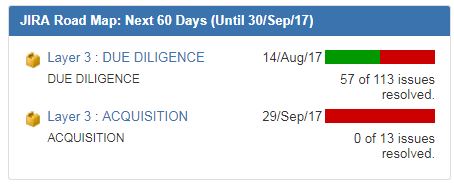
Road Map Gadget
The Road Map gadget is a visual representation of the progress of a project or group of issues over time. It allows users to see the status of individual tasks and how they relate to the project’s overall timeline. The gadget can be customized to show different types of data and can be filtered by issue type, assignee, and other criteria. Overall, the Road Map gadget is useful for project managers and team members to stay on top of progress and identify potential roadblocks. Few advantages include
- Provides a high-level view of the project’s progress and timeline, making it easier for project managers and team members to understand where the project stands.
- Enables users to see the interdependencies between different tasks and issues, helping them to identify potential roadblocks and plan accordingly.
- Allows for easy filtering and customization, so users can view the most relevant data to their specific needs.
- Helps team members stay on the same page by providing a shared visual representation of the project’s progress.
- Offers a way to quickly identify issues that may be at risk of falling behind schedule or being blocked, allowing team members to take proactive steps to address these issues.
How to Create a Road Map on Jira Dashboard
- The following steps show how to install a Jira Roadmap for your ongoing project.
- Scroll to your project’s sidebar and click on Project Settings.
- Then, select Features. You will see the Road Map among the list of features as shown by the below image.
- Click on the Road Map Gadget to enable the feature. If you don’t want the Road Map Gadget to appear on your Dashboard any longer, you can also disable it here.
- ‘Projects‘ — select one or more projects (or ‘All Projects’) whose versions you wish to display in the gadget.
- ‘Days‘ — specify the period of time (in days) for which you wish to view versions due for release.
- ‘Number of Results‘ — type the maximum number of versions you wish the gadget to display per page.
- ‘Refresh Interval‘ — select how often you want the gadget to update the displayed activity (never / every 15 minutes / every 30 minutes / every hour / every two hours).
Created vs Resolved Gadget
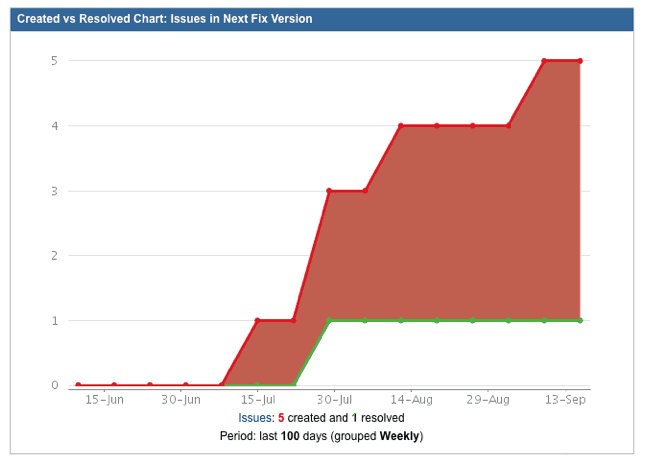
The Created vs Resolved Gadget is a useful tool within JIRA that allows teams to track the number of issues that have been created versus the number of issues that have been resolved over a specified time period. By utilizing this gadget, teams can quickly identify trends in project progress and prioritize their work to ensure that they are making progress on their projects.
Adding the ‘Created vs Resolved Issues’ gadget to your Dashboard
- Go to your JIRA dashboard and click ‘Add Gadget’.
- The ‘Gadget Directory’ will appear. Locate the ‘Created vs Resolved’ gadget and click the ‘Add it Now’ button. Then click the ‘Finished’ button at the bottom of the Gadget Directory.
- The ‘Created vs Resolved’ gadget will appear on your dashboard as follows, ready for you to configure:
- ‘Project or Saved Filter’ — start typing the name of the project (or saved filter) on whose issues the chart will be based. Alternatively, if you’re unsure of the name of the project or filter you’re looking for, click ‘Advanced Search’ to search for a project (or saved filter) whose name contains particular text; or a saved filter that was created by a particular user and/or is shared with particular users.
- ‘Period’ — select the timeframe on which the chart will be based:
- ‘Hourly’
- ‘Daily’
- ‘Weekly’
- ‘Quarterly’
- ‘Yearly’
- ‘Days Previously’ — enter the number of days’ worth of data (counting backwards from today) to be included in the chart.
- ‘Cumulative Totals?’ — choose either:
- ‘Yes’ to progressively add data to the preceding column; or
- ‘No’ to show just a single value in each column.
- ‘Display the Trend of Unresolved?’ — choose either:
- ‘Yes’ to display an additional line graph showing the number of unresolved issues over time; or
- ‘No’ to show just the difference chart of issues created vs issues resolved.
- ‘Display Versions?’ — choose either:
- ‘All versions’ to show version release dates on the chart, for all released versions; or
- ‘Only major versions’ to show version release dates on the chart, for released versions that are named ‘x.x’ only; or
- ‘None’ to not show version release dates on the chart.
- ‘Refresh Interval’ — select how often you want the gadget to update the chart (never / every 15 minutes / every 30 minutes / every hour / every two hours).
- Click the ‘Save’ button.
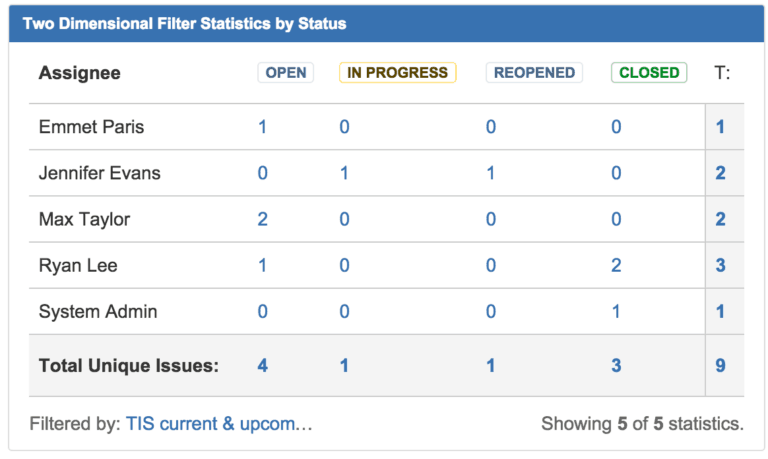
Two-Dimensional Filter Statistics Gadget
This gadget allows teams to view statistics based on two different filter parameters. The Two-Dimensional Filter Statistics Gadget can be useful for identifying patterns in project data based on multiple parameters. For example, you can use this gadget to view how many issues are assigned to each team member based on their status, or how many issues are assigned to each team member based on their priority.
One of the main benefits of the Two-Dimensional Filter Statistics Gadget is that it allows teams to quickly and easily identify patterns and trends in their project data. This can help teams to make informed decisions about their projects and prioritize their work accordingly. By utilizing this gadget, teams can quickly identify patterns and trends in their project data and make informed decisions about their projects.
Adding the Two-Dimensional Filter Statistics gadget to your Dashboard
- Go to your JIRA dashboard and click ‘Add Gadget’.
- The ‘Gadget Directory’ will appear. Locate the ‘Two Dimensional Filter Statistics’ gadget and click the ‘Add it Now’ button. Then click the ‘Finished’ button at the bottom of the Gadget Directory.
- The Two Dimensional Filter Statistics gadget will appear on your dashboard as follows, ready for you to configure:
- ‘Saved Filter’ — start typing the name of the filter, or click the ‘Advanced Search’ link to search for a filter/select one of your favorite filters/select a filter that you have created.
- ‘X Axis’ — select an issue field¹ on which the X-axis will be based.
- ‘Y Axis’ — select an issue field¹ on which the Y-axis will be based.
- ‘Sort By’ — select how to sort the values of your selected field:
- ‘Natural’ — this will use the field’s native sorting order, e.g. for the “Assignee” field, the assignee names would be sorted alphabetically.
- ‘Total’ — this will sort by the number of issues that match each value, e.g. for the “Assignee” field, the assignee names would be sorted by the number of issues assigned to each person.
- ‘Sort Direction’ — select whether the field values should be sorted in Ascending or Descending order.
- ‘Number of Results’ — type the maximum number of rows that you want the gadget to display per page
- ‘Refresh Interval’ — select if you want the gadget to update automatically.
- Click the ‘Save’ button.
Pie Chart Gadget
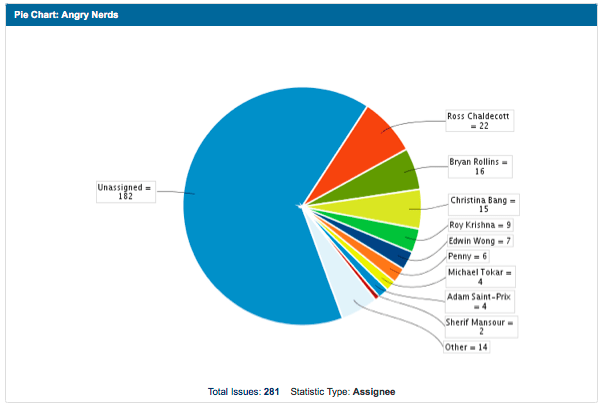
The Pie Chart Gadget is useful for providing a quick overview of project data in a visual format. The ‘Pie Chart’ gadget displays issues returned from a specified project or issue filter, grouped by a specified field. For example, you can use this gadget to view how many issues are open or closed, or how many issues are assigned to each team member.
One of the main benefits of the Pie Chart Gadget is that it allows teams to quickly identify patterns and trends in their project data. This can help teams to make informed decisions about their projects and prioritize their work accordingly. By utilizing this gadget, teams can quickly identify patterns and trends in their project data and make informed decisions about their projects.
Adding the ‘Pie Chart’ Gadget to your Dashboard
- Go to your JIRA dashboard and click ‘Add Gadget’.
- The ‘Gadget Directory’ will appear. Locate the ‘Pie Chart’ gadget and click the ‘Add it Now’ button. Then click the ‘Finished’ button at the bottom of the Gadget Directory.
- The Pie Chart gadget will appear on your dashboard as follows, ready for you to configure:
- ‘Project or Saved Filter’ — start typing the name of the project or filter, or click the ‘Advanced Search’ link to search for a project or filter.
- ‘Statistic Type’ — select the field on which the pie chart will be based.
- ‘Refresh Interval’ — select how often you want the gadget to update the chart (never / every 15 minutes / every 30 minutes / every hour / every two hours).
- Click the ‘Save’ button.
Average Age Gadget
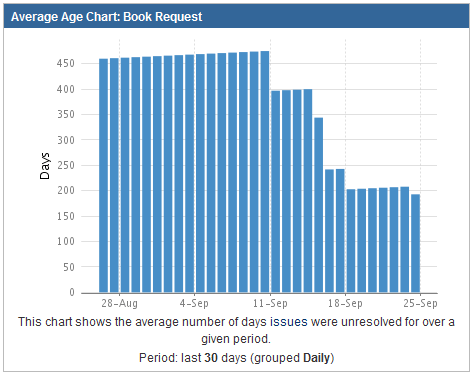
The ‘Average Age’ gadget displays a bar chart showing the average age (in days) of unresolved issues at given points in time. The report is based on your choice of project or issue filter, and your chosen units of time (ie. hours, days, weeks, months, quarters or years). For the purposes of this gadget, an issue is defined as unresolved if it has no value in the system Resolution field. The age of an issue is the difference between the current date and the created date of the issue.
One of the main benefits of the Average Age Gadget is that it allows teams to track the progress of their projects over time. By monitoring the average age of issues, teams can identify areas where improvements are needed and take action to address any issues. By utilizing this gadget, teams can identify areas where improvements are needed and take action to address any issues, helping to ensure that projects are completed on time and within budget.
Adding the ‘Average Age’ gadget to your Dashboard
To add the ‘Average Age’ gadget to your dashboard:
- Go to your JIRA dashboard and click ‘Add Gadget’.
- The ‘Gadget Directory’ will appear. Locate the ‘Average Age’ gadget and click the ‘Add it Now’ button. Then click the ‘Finished’ button at the bottom of the Gadget Directory.
- The Average Age gadget will appear on your dashboard as follows, ready for you to configure:
- ‘Project or Saved Filter’ — start typing the name of the project (or saved filter) on whose issues the chart will be based. Alternatively, if you’re unsure of the name of the project or filter you’re looking for, click ‘Advanced Search’ to search for a project (or saved filter) whose name contains particular text; or a saved filter that was created by a particular user and/or is shared with particular users.
- ‘Period’ — select the timeframe on which the chart will be based:
- ‘Hourly’
- ‘Daily’
- ‘Weekly’
- ‘Quarterly’
- ‘Yearly’
- ‘Days Previously’ — enter the number of days’ worth of data (counting backwards from today) to be included in the chart.
- ‘Refresh Interval’ — select how often you want the gadget to update the chart (never / every 15 minutes / every 30 minutes / every hour / every two hours).
- Click the ‘Save’ button.
Issue Statistics Gadget
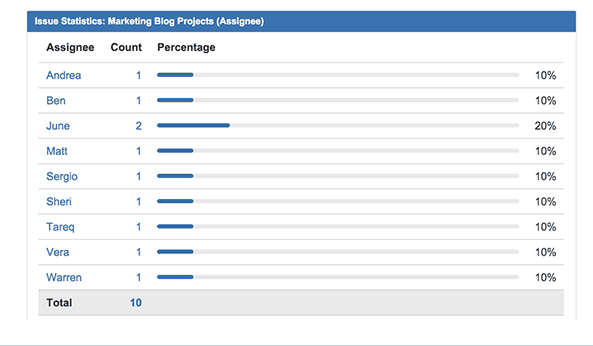
The Issue Statistics gadget displays the collection of issues returned from a specified project or saved filter, grouped by a specified field. For instance, a filter can be created to return all open issues from all projects. The gadget can then be configured to display these issues broken down by a field (e.g. Assignee).
Adding the ‘Issue Statistics’ gadget to your Dashboard
Go to your JIRA dashboard and click ‘Add Gadget’.
- The ‘Gadget Directory’ will appear. Locate the ‘Issue Statistics’ gadget and click the ‘Add it Now’ button. Then click the ‘Finished’ button at the bottom of the Gadget Directory.
- The Issue Statistics gadget will appear on your dashboard as follows, ready for you to configure
- ‘Project or Saved Filter’ — start typing the name of the project or filter, or click the ‘Advanced Search’ link to search for a project or filter.
- ‘Statistic Type’ — select the field (e.g. Assignee; Component; Priority; Resolution; etc) on which the issues will be grouped.
- ‘Sort By’ — select how to sort the values of your selected field:
- ‘Natural’ — this will use the field’s native sorting order, e.g. for the “Assignee” field, the assignee names would be sorted alphabetically.
- ‘Total’ — this will sort by the number of issues that match each value, e.g. for the “Assignee” field, the assignee names would be sorted by the number of issues assigned to each person.
- ‘Sort Direction’ — select whether the field values should be sorted in Ascending or Descending order.
- ‘Show Resolved Issue Statistics’ — select whether the graph will include resolved issues (i.e. issues that have a Resolution).
- ‘Refresh Interval’ — select how often you want the gadget to update (never / every 15 minutes / every 30 minutes / every hour / every two hours).
- Click the ‘Save’ button.
Watched Issues Gadget
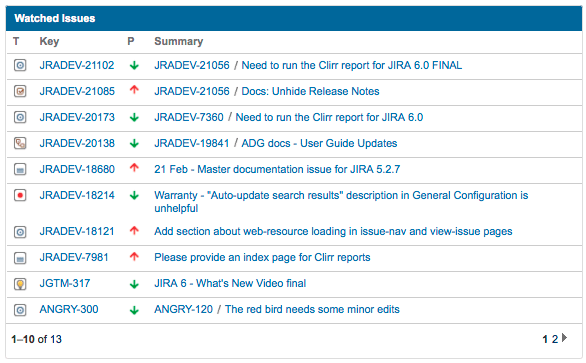
The Watched Issues gadget shows issues that you are watching. By using this gadget, users can quickly see updates on their watched issues without having to navigate to each issue individually.
One of the main benefits of the Watched Issues Gadget is that it allows users to stay informed about important updates on issues they are interested in. By monitoring watched issues, users can quickly respond to updates and ensure that they are up-to-date on any changes or developments.
Adding the ‘Watched Issues’ Gadget to your Dashboard
Go to your JIRA dashboard and click Add Gadget.
- The Gadget Directory will appear. Locate the Watched Issues gadget and click the Add it Now button. Then click the Finished button at the bottom of the Gadget Directory.
- The Watched Issues gadget will appear on your dashboard as follows, ready for you to configure
- Number of results — type the maximum number of issues that you want the gadget to display per page.
- Fields to display — select the issue fields to display as columns. Drag and drop to re-order.
- Refresh Interval — select how often you want the gadget to update the displayed activity (never / every 15 minutes / every 30 minutes / every hour / every two hours).
- Click the Save button.
How to Manage Shared JIRA Dashboards
An administrator can change ownership of another user’s dashboards — for example, when a person leaves the team and a new member fills their position.
- On the right side, click the gear icon and then click System.
- In the left column, scroll down to Shared Items. Click Shared dashboards.
- Find the dashboard you want to transfer, and click the ellipses
- Type in the name of the new owner. Click Change owner.
- If you work with many dashboards, locate the one you want by searching for it by name or by dashboard owner.
How to Customize JIRA Dashboard Gadgets
Settings are specific to each available gadget, but you can customize the size and general style. The following images show a gadget’s editing page and its implementation.
At any time you can edit the settings of a gadget to change the information it gathers and displays and how often it updates. Keep in mind that settings are not the same across all gadgets.
Edit Gadget Settings – In the gadget, click the ellipses and then click Edit.
Change the Look of a Gadget
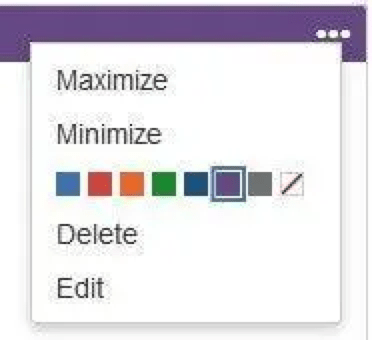
- Hover over the gadget until the ellipses appear. Click the ellipses. On the menu, click Minimize, Maximize, or Restore.
- To change the gadget’s color or remove color, select an icon from the palette.
Best practices for configuring Agile dashboard gadgets
Guides from Atlassian and partners highlight several best practices when configuring gadgets for Agile teams.
- Design for a specific audience and purpose – Separate dashboards for teams, leadership, and service desks prevent one cluttered “everything” view.
- Use good filters and JQL – Back gadgets with well‑named filters that reflect real questions (for example,
Blockers in current sprint,Bugs in Ready for QA). - Limit the number of gadgets – Too many gadgets dilute attention; focus on 6–10 that clearly support daily decisions.
- Validate with the team – Review dashboards in stand‑ups and retrospectives to ensure the chosen gadgets still match how the team works.
- Iterate over time – As workflows, boards, and goals evolve, retire outdated gadgets and add new ones; dashboards are living tools, not static reports.
Conclusion
A Jira dashboard becomes truly valuable when it shows the right set of gadgets for a team’s context: burndown, sprint health, velocity, CFDs, workload charts, and targeted filters for blockers and high‑priority work. By starting from clear questions, selecting a small set of well‑configured gadgets, and evolving the dashboard over time, Agile teams can turn Jira dashboards into effective information radiators that support daily stand‑ups, sprint reviews, Kanban flow management, and portfolio oversight.