WSJF

WSJF is a Prioritization method that helps calculate and understand what is the level of the financial impact of not finishing the task or implementing the solution sooner than later. a prioritization model used to sequence jobs (eg., Features, Capabilities, and Epics) to produce maximum economic benefit. At the end of the calculation of the WSJF, the features to be realized will be found in a very particular order:

  • Features that are not complex but that have a high added value.
  • Complex features that have a high added value.
  • Features that are not complex with a lesser added value.
  • Complex features with a lesser added value.

To calculate the WSJF score we need to first assign four metrics to our priorities – 

  • Business Value 
  • Time Criticality
  • Risk Reduction 
  • Estimated Size

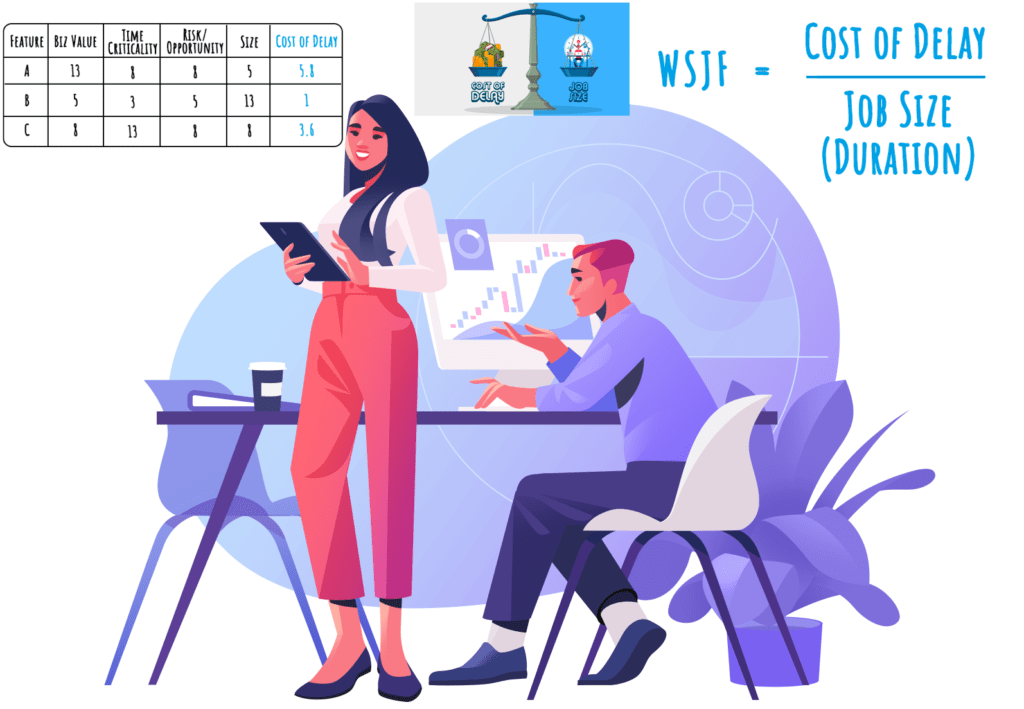
Weighted Shortest Job First (WSJF) = Cost of Delay (COD) / Job Size (Duration) 

Cost of Delay (COD) = (Business Value + Time Criticality + Risk Reduction)

The higher the ratio the higher the value of the item being evaluated should be to the business.

Cost of Delay is estimated using the sum of three factors:

Estimated/User Business Value: It ranks your jobs by their relative importance to the user and potential impact on revenue. Answer the questions

  1. How beneficial to our organization or relative value to the customer or business is this feature? 
  2. Why would a user prefer this job over another?
  3. How much money or impact on revenue will be made? 
  4. How many customers will we retain? 
  5. What cost will we reduce?
  6. What’s a vital product metric you can update?
  7. Is there a potential penalty or other negative effects if we delay?

For example, enterprises’ security login options will help avoid complaints from large customers, which leads to sales.

Time Criticality: It ranks the jobs by urgency e.g. deadlines like new regulations, tax reporting, seasonal promotions, etc. 

  1. How the user/business value will decay over time or how many customers we may lose if we linger
  2. Is there a fixed deadline? Will users wait or move to another solution? 
  3. How urgent is it for the business? 
  4. Are there Milestones on the critical path impacted by this?
  5. What is the current effect on customer satisfaction?
  6. How fast do we need to get this feature out before we start losing customers?

Risk Reduction and/or Opportunity Enablement: Tasks to avoid or reduce technological or business risks. Examples include code refactoring, database update, security, or tax audit – something that you must do to ensure the healthy operating of a product. It helps you highlight jobs that may not bring revenue immediately but benefit the long run. Some solutions will help you eliminate technical or legal risks and save you money later.

  1. What else does this do for our business? Will this feature reduce our risk or help us get new business opportunities?
  2. If the task starts with some risk description, how big of an impact will that risk be? What is the probability of the risk?
  3. Does it reduce the risk of this or a future delivery?
  4. Is there value in the information we will receive?

Job Size: It is also called Story Points, Feature Points, Duration, Effort, or Relative Size. With this estimation, the smaller the number, the better.

  1. How long will the implementation take?
  2. Are there dependencies that can make it more time-consuming?

You can use Fibonacci numbers for the components of Cost of Delay. Each criterion should be evaluated with a scale of 1, 2, 3, 5, 8, 13, 21.

User-Business Value – Fibonacci Sequence

  • 1 point: no user-business value at all; this task is related to something else.
  • 2 points: the lowest business impact and confidence.
  • 3 points: low business impact and confidence.
  • 5 points: moderate business impact, moderate confidence.
  • 8 points: high business impact and confidence.
  • 13 points: very high business impact and confidence.
  • 21 points: the highest business impact and confidence.

Time Criticality – Fibonacci Sequence

  • 1 point: not a time-critical task at all.
  • 2 points: it can wait till the next estimation cycle (after score expiration every five interactions).
  • 3 points: it can wait for four sprints (about eight weeks).
  • 5 points: moderate urgency, it can wait for three sprints (about six weeks).
  • 8 points: it can wait for two sprints (about four weeks).
  • 13 points: it can wait for one sprint (about two weeks).
  • 21 points: the highest urgency, you must take that issue to the next sprint.

Risk Reduction – Fibonacci Sequence

  • 1 point: it doesn’t provide any risk reduction at all.
  • 2 points: reduce the likelihood of the lowest risk and lowest severity probability.
  • 3 points: reduce the likelihood of a low-risk, low severity probability.
  • 5 points: reduce the likelihood of moderate-risk and moderate severity probability.
  • 8 points: reduce the likelihood of a moderate-high risk, high severity probability.
  • 13 points: reduce the likelihood of a very high-risk, very high severity probability.
  • 21 points: can reduce the risk of a highly impactful event, a disaster that is most likely to happen.

Job Size – Fibonacci Sequence (story points)

  • 1 point: no effort at all is required. We can’t divide by zero, so our Job Size estimation should start from 1.
  • 2 points: the estimation baseline. 80% probability that one day is enough to code and one day to test and validate for a two-week iteration.
  • 3 points: a task about a quarter of your sprint efforts.
  • 5 points: something half of your iteration. 80% probability that the task will take 5 workdays to code and one day to test and validate for a two-week iteration.
  • 8 points: 80% probability that a task will be developed and tested within two weeks (one iteration/sprint).
  • 13 points: between one and two iterations.
  • 21 points: “Buzzlight estimations,” something that takes two sprints or even more (“to infinity and beyond”). From my practical experience working with teams, you will be evaluating lots of ideas that exceed one iteration and should be divided into smaller chunks.

E.g. Team will work on Features A, B & C.

FeaturesBusiness ValueTime CriticalityRisk/OpportunitySizeCost of Delay (COD)
A55853.6
B535131
C813855.8

Let’s multiply $1000 with COD to put in terms of dollars/week.


Cost of Delay (COD)DurationScore
Feature A3600/week4 weeks900
Feature B1000/week1 week1000
Feature C5800/week2 weeks2900

First-in, First-out (FIFO)

Work is picked up one at a time in the order they arrived i.e. A, then B, then C.

For 4 weeks team worked on Feature A so the Cost of Delay of all three features = $3600/wk + $1000/wk + $5800/wk = $10400/wk. For 4 weeks COD = $41,600

Once we’ve delivered Feature A we can then move on to developing Feature B. For 1 week team worked on Feature A so the Cost of Delay of Features B and C = 1000/week + 5800/week = 6800/week. So now the total COD = $41,600 + $6,800 = $48,400

After Features A & B now it is turned for Feature C which will take 2 weeks. So Cost of Delay of Feature C = 5800/week. For 2 weeks COD = $11,600

Total Cost of Delay = $41,600 + $6,800 + $11,600 = $60,000

Weighted Shortest Job First (WSJF)

With WSJF the features are based on whichever has the highest Score we would do Feature C first, followed by Feature B, and finally Feature A.

The Cost of Delay while working on Feature C is $3600/wk + $1000/wk + $5800/wk = $10400/wk. For 2 weeks it will be $20,800.

The Cost of Delay while working on Feature B is $1000/wk + $5800/wk = $6800/wk. For 1 weeks it will be $6,800. At this point total Cost of Delay is $20,800 + $6,800 = $27,600.

The Cost of Delay while working on Feature A is $3600/wk. For 4 weeks it will be $14,400. At this point total Cost of Delay is $20,800 + $6,800 + $14,400 = $42,000.

The difference in COD between FIFO & WSJF = $60,000 – $42,000 = $18,000

Pros of WSJF

  1. Promotes completeness and consistency. Due to the prescribed detailed calculation, stakeholders can expect reliable and predictable results with this prioritization method.
  2. Brings clarity and understanding. The model brings clarity by pinpointing specific items that should be tackled first and provides clear insights on how the prioritization decision was made.
  3. Takes into account technology constraints and implementation efforts. This prioritization technique considers not only the cost of delay (value, but also time criticality and risk reduction/opportunity enablement) but also takes into account the technical aspect. It tells us (in relative terms) how difficult and time-consuming the development of each feature would be.
  4. Focuses on increasing return on investment while making efficient use of human resources (hence suitable for organizations with limited resources).

Cons of WSJF

  1. Time-consuming calculations. If there are lots of backlog items then the team needs to spend significant time prioritizing them using this method. It also takes time to estimate the values for each of the components of WSJF.
  2. In complex initiatives/projects, if the business has a sustainable idea, but the WSJF calculations do not show a high score to make it to the top of the list, its implementation will most certainly be postponed to a later stage. This makes the method a bit restrictive in implementing considerable, long-term, business ideas. Overall, similar to the Value vs Effort method, we can say that the WSJF method prioritizes short wins over big and time-consuming projects.
  3. Relative scales estimate are easier than absolute numbers and avoid unnecessary precision. Calculating Cost of Delay by summing up relative numbers of business/customer value and time criticality could sometimes lead to bad decisions or suboptimal job sequencing, as we compare items that move different economic indicators. This could create problems unless the relative scales are set upright and aligned with all stakeholders. Since it is hard to align all metrics and assumptions to achieve balance, the method has room for errors and is not recommended for important cut-off decisions.
  4. Similar to the other agile prioritization methods, WSJF’s scores are subjective, meaning that the assessment is only as good as the ones giving the scores.
  5. WSJF makes a few important assumptions worth highlighting:
    1. WSJF assumes that the critical resources on a project are the same and they are all busy during the entire duration of the project.
    2. WSJF does not take into account specialized human resources (e.g. employees with a specialized skillset or expertise/competence in a specific area). Those resources will in general be assigned to work on the highest priority items depriving the lowest priority items of moving forward (in case their contribution is also needed there).

Tips for WSJF Prioritization Technique

Five steps aid us in prioritizing product features leveraging the Weighted Shortest Job First (WSJF).

The key to using this process is learning how to break down your work into manageable chunks that are understandable by the users at the Epic level (executive & program/product management) and the users at the Feature level (program/product management and project management).

  • Step 1: Break your Programs into Epics.
  • Step 2: Break your Epics Into Features.
  • Step 3: Have your product owners use planning poker to assign feature business value.
  • Step 4: Have your technical leads use planning poker to assign feature T-shirt sizes (high-level estimates).
  • Step 5: Review your WSJFs and Feature Dependencies to determine the order of your Feature Backlog.

PI Planning – Click Here SAFe WSJF – Click Here

Scroll to Top