A Burndown chart is a graphical representation of work left to do versus time. Each point on the chart shows how much work was left to do at the end of that day (or week, month or other time period). In the Daily Scrum the Development Team updates the Sprint Burndown and plots the remaining work of the day. It is a chart that horizontally tracks progress and Y – axis denotes story points and X – axis denote number of days. There are three types of burndown charts
- Release Burndown Chart – Tracks the progress of release in a Scrum project.
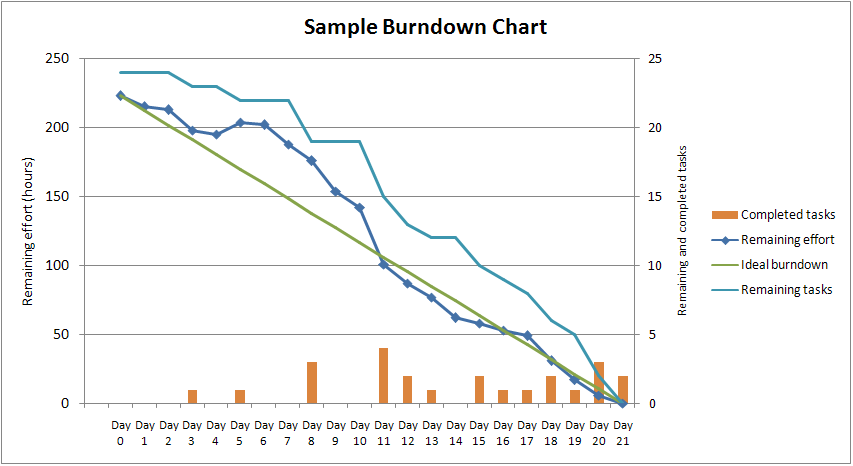
- Sprint Burndown Chart – Tracks the amount of work remaining versus time.
- Product Burndown Chart – Tracks amount of work left to do to meet all the product goals.
The burndown chart indicates two important things:
- The work remaining line shows you how much work remains in the project, and how quickly the team has progressed to date.
- The burn-down velocity line indicates expected time to complete the sprint or release.
At the beginning of the sprint all Story points scheduled for the sprint are yet to be completed. So start at the top left corner of the graph. As days goes by and team complete user stories, X axis will move to right to show days left and Y axis will drop down to show how many story points are remaining. Let’s say
- If the burndown is going up, then work is being added in the Sprint.
- If it’s flat and then drops at the end of the Sprint, your User Stories may be too big.
Pros:
- A simple visual representation of the work progress, so all team members can benefit.
- Completed work and the work remaining.
- If deadlines are being met or if changes need to be made. A project’s progression.
- If a team should put more effort into specific areas.
Cons:
- They aren’t very detailed tools. They are limited in their capacity to show tasks that are currently being addressed and can’t estimate how long these tasks will take to complete. Predictions may, therefore, be inaccurate.
- They might be demoralizing if they display unrealistic predictions or if team members feel micromanaged.
- Burndown chart can hide important information, for example the effects of scope change(work is added to or removed).
Few scenarios where Burndown chart is helpful to take decision
- Product Owner asked to add one story as it is on high priority, and the functionality of this story is very critical to deliver by this sprint end.
- One of the resource needs to go on sick leave for medical emergency for couple of days.
- During 2nd week of the sprint testing team raised too many bugs, that needs to be resolved with in the sprint duration.
Burnup vs Burndown Chart
A Burndown chart shows the amount of work remaining on a project (the remaining effort), whereas a Burnup chart shows how much work has been completed and the total scope of the project. In a Burndown chart, the line goes from top to bottom as a team makes progress, while in a Burnup chart the line climbs from the bottom upwards. Both charts use the same axies.
BurnDown Scenarios and Resolutions
Straight Actual Line
You might have encountered your team sprint burndown have straight lines for couple of days. That can caused by one or more of the following reasons
- Team is not updating the remaining task hour on daily basis
- Team has not created all the tasks, so not able to change the remaining hours
- Task estimation was underestimated, so remaining hour are not changing
- Team is not able to proceed as impediments blocking user stories and not resolved.
- Environmental issue like development server not available to do coding or test environment not accessible for testing
Resolution
- Make sure each and every team member update the remaining hours of the task they are working on daily basis.
- During Tasking of user story, don’t take it lightly, take your time to create and estimate tasks as accurate as possible.
- Try to resolve the impediments, as soon as possible, if some stories are blocked, don’t wait for its resolution, start working on the stories, if all the stories are blocked and that may take couple of days to resolve, inform Product Owner and act accordingly.
- Before starting the sprint map all your dependencies, resolve the dependencies first then commit the story, till the time the dependencies are not resolved work on independent stories.
- Resolve all environmental issue, check availability and accessibility before starting the sprint.
Actual line touching the ground much before the last date of the sprint
If you notice that the actual line is touching the ground much before the ideal line, that means one or more of these.
- The team has worked aggressively, burned more hours per day as per the capacity
- The Team has committed less than the capacity
- The team has over estimated the task.
Resolution
- If the team willingly work hard, its good, but its always better to have defined hours of work to be done. working extra hours every day may cause other negative effects. Plan your capacity based on the best optimized amount of work the team can perform.
- If the team commits less than the capacity, that happened because most of the time because of insufficient amount of requirement, Product Owner may not have enough story ready to commit at the time of planning. Work on frequent and regular grooming to have your backlog healthy.
- Estimate fare, make it as accurate as possible
Actual line have Sudden Spike
If you notice that your actual burn down line has a sudden spike upward, its means there are
- change on scope (Scope Increased between sprint duration), You PO may have asked to add one or few stories to the current sprint.
- Or the team has re-estimated the task to increase the remaining work.
Resolution
- Mature up your Sprint Planning, Have your backlog healthy so that you can fully utilize your capacity during sprint planning, by committing max possible product backlog item in priority.
- Do a task breakdown thoroughly, create all the possible tasks created, estimated and assigned. so that you don’t need to re-estimate during sprint duration.
Ideal line and capacity line have too much difference on day 1
If your ideal line and capacity line have a big distance means, The team has not committed their full capacity. because of
- Unavailability of enough user stories in ready state, so team has ended up the sprint planning with
- or Team is not confident to utilize the full capacity, hence only partial capacity.
Resolution
- Again Continuous backlog grooming to have healthy backlog of ready to work on Items.
- Understand the requirement in details covering all aspects. Then only commit the user story during sprint planning. Let individual team member create, estimate and assigned tasks for them. continue the planning till the max capacity utilized.
Actual line is out side the ideal line for consistence days and difference in increasing
This state is very risky, and a clear indication that the team will not be able to complete all the committed work item by end of the sprint. This cause because of many reason like
- Even the team is working as expected, but they are not updating the remaining hours.
- The Team is actually not working
- Impediments blocking team’s progress.
- The team has found estimated task hours are too low, need to work more, instead of re-estimating the task, they are not updating the remaining hours, working to bring the remaining hours as per burn down.
Resolution
- Please update the remaining hours every day, it may bring some spike, it will depict the real picture.
- Rest of the cases resolution varies from team to team, analyze it and take a best suited corrective action.
Straight lines and Sudden drop of actual line
This is the typical case, you might have encountered, The reason behind this can be because any of these reasons
- Mostly occurs, when team use story points as y axis of their burn down.
- remaining work updates are not happening, regularly.
- remaining work updates happen only on last date of the sprint as a formality.
Resolution
- Start task breakdown, and have the Y axis of your burndown with task hours.
- Update Remaining hours on daily basis.
Burndown Chart using JIRA
The Burndown Chart only applies to Scrum boards. Below are the steps for viewing Burndown Chart in JIRA.
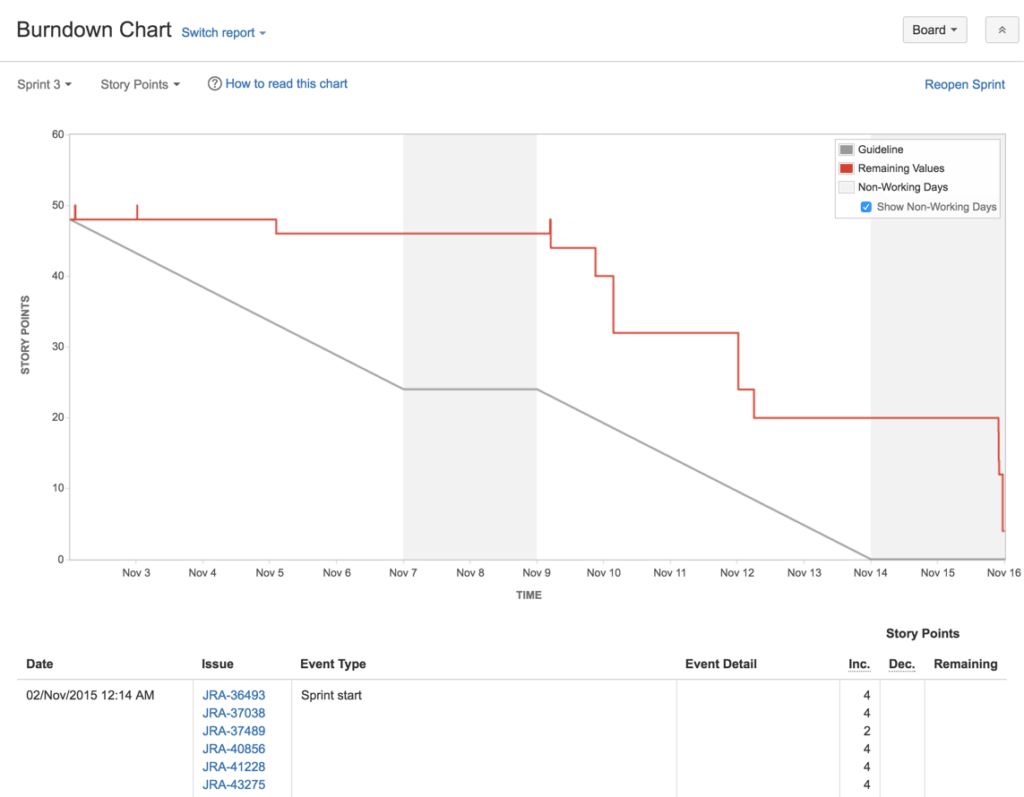
- Navigate to your desired board.
- Click Reports, then select Burndown Chart.
- To choose a different sprint, click the sprint drop-down.
- To choose a different estimate statistic, click the estimation statistic drop-down.
Few Estimation statistic are Story Points, Original Time Estimate, Business Value, Issue Count or on basis of Custom Field.
Reference: https://agiledigest.com/agile-digest-tutorial-2/sprint-burndown-chart/