Ishikawa diagram is a graphic technique, that is used for displaying the characteristics of a given situation or problem. It is also known as Fishbone Diagrams, Herringbone Diagrams, Cause-and-Effect Diagrams, or Fishikawa. Ishikawa diagrams are used for defect analysis (Root Cause Analysis). It is very useful when the analyzed defect has multiple causes. A problem or the defect statement is placed at the “head” of the diagram, and categories for grouping potential causal factors are placed as “bones.” This will be referred to as a “problem Ishikawa.” The technique is useful in brainstorming sessions to identify potential causes and areas for further investigation. It could be used in affinity diagram sessions too.
Ishikawa diagrams can also be an effective tool for communicating what essential factors are needed to achieve a positive outcome or result. As described here, this “positive Ishikawa” will have the desired effect at the “head” and categories of enablers or factors as the “bones”. You can use it in your Sprint Retrospective.
A Positive Ishikawa diagram can provide a beginning to solutions development. The diagram will show the factors needed to invent a new approach, new business philosophy, or achieve a goal. They are constructed in the same manner as a problem Ishikawa, except enablers replace causes and a desired effect or goal replaces the problem. This application of the technique can be quite useful, during goal setting or implementation planning. Actions to affect the required change can then be derived from reviewing the enablers.
This technique can also be used to analyze the causes of problems inherent in an activity flow. Use the activity flow as the backbone of the Ishikawa with the desired activity result (or output) at the “head.” For each activity on the flow, brainstorm possible causes (and/or enablers), and document them on the diagram radiating out from the activities.
Applications of Ishikawa Diagram
- To display causal relationships of a given situation or problem.
- To brainstorm or identify potential causes, areas for further investigation, and/or solutions (problem Ishikawa).
- To depict factors leading to a successful outcome or result (positive Ishikawa).
- To help cross-functional organizational units understand interaction relationships.
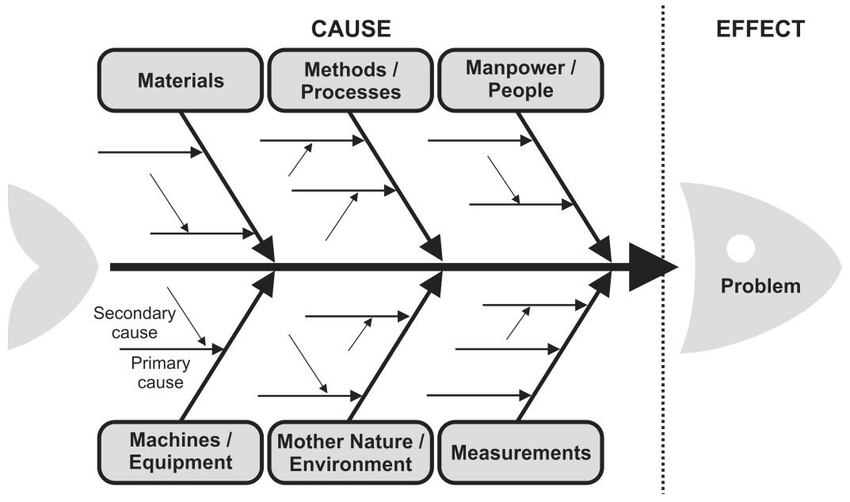
Categorization of Causes in an Ishikawa Diagram
Every industry uses fishbone diagrams; however, they may have a different categorization of causes. You need to customize the category to your requirements.
- Machine
- Materials
- Methods
- Personnel
- Measurements
- Environment
Alternatively, you may also use the five whys a technique or the 4 P’s (Product, Policies, Procedures, and Plant).
Steps in an Ishikawa Diagram
- Identify and agree on the problem statement (effect) -Examine all the elements and factors that hinder an organization from achieving its objectives. Conduct interviews, and brainstorming sessions and document findings to determine customer problems.
- Review candidate problems – Review all candidate problems from the consolidated lists obtained during the interview process.
- Remove duplication – Remove duplication and combine like problem statements to synthesize the list into a manageable size. (Assign original problem numbers for tracking.)
- Print a problem list and cut problems into individual strips – Reprint the problem statements, cut them into individual strips, and tape the strips to a flip chart or board for review.
- Construct a general problem statement and place it at the “head” of the diagram – Construct an overall problem, main effect, or customer satisfier statement at the “head” of the diagram (Right-hand side center with a box around it and draw a horizontal arrow running to it).
- Identify cause categories (problem Ishikawa) or enabler categories (positive Ishikawa), and place them at end of the fish’s “ribs” or “bones.” – Identify and confirm cause categories for a problem Ishikawa (or enabler categories for a positive Ishikawa), and place in boxes at the end of the fish’s “ribs” on the right-hand side. This can be done using brainstorming or derived from interview notes. Typical categories (shown in the example) include Machine, Materials, Methods, Personnel, Measurements & Environment. The following categories may also be used to group causes or enablers: system, policy, vendor, people, procedures, and/or technical expertise.
- Review the problem list and determine if cause or effect -Examine each item from the list available, and determine the best “fit” under each one of the categories. If a list is not available, brainstorm to populate each category with potential causes (problem Ishikawa) and/or enablers (positive Ishikawa). Alternatively, review each item in the consolidated problems list and ask: “Is this a cause, or does this sound like an effect?” then “Why?…Why?…Why?…” to separate root causes from their effects and to separate out problems from symptoms. Exhaust the list of possibilities and discover additional causes. Circle or highlight the most probable causes, being careful not to include symptoms. Discuss and prioritize analysis/solution generation with the team members.
- Determine the most probable causes and place them on the final diagram – Validate the most probable causes with the team members, review raw notes and other information collected by the team, and listen to gut hunches. These are the ones that will be placed on the final diagram.
Important Points while developing an Ishikawa Diagram
- You should have a clear understanding of the problem.
- Team members should be experienced and involved with the problem.
- The discussion should be under the project manager.
- Think of all possible causes for each factor and add them to the fishbone.
- If any bone is bulky, try to split it into two or three branches.
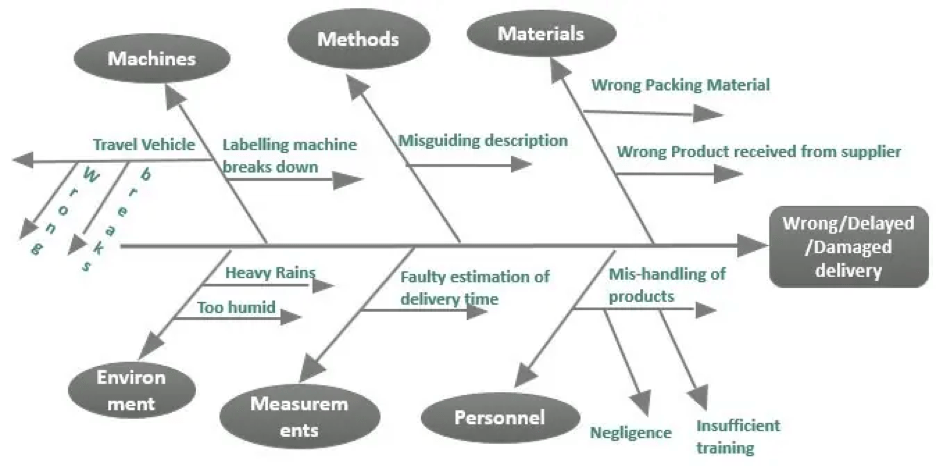
Example: Let’s try an example where the problem that needs our attention is wrong/delayed/damaged delivery.
The possible reasons are many, like faulty packaging that led to damage during transit, the wrong product being released for delivery, or the address label on the product wasn’t correct. We can classify the same in main causes and present it in the fishbone diagram like below:
Example: The team is not predictable. Never know when the product will be ready.
Q: What makes the team unpredictable?
C: Changes coming through all the time.
Q: Where do the changes come from?
C: Normally from the business, who is the visionary of the product, and a bit from our users, but those are usually minor changes.
Q: When is the most critical time?
C: When marketing wants insights in order to prepare campaigns, compliance with a federal mandate forces us to commit to a certain functionality several Sprints before the product launch.
Q: Who can influence that?”
C: Our Application Owner, who might be more present during the release and make his comments at every Sprint Review.
Q: Why is he not present at each Sprint Review?
C: He joined the first few reviews, but we didn’t deliver much functionality at that time, so he gradually stopped coming. Maybe it’s time to invite him again.
Summary
An Ishikawa Diagram is a vital tool in identifying the root cause as a visual representation of a problem. Although it is time-consuming, the benefits are enormous as instead of pointing out just one reason, this technique gives us all the possible reasons that assist not only in identifying the root cause of the current problem and avoiding any future mishappening.
This tool helps you remove the root cause of the problem and develop an understanding among team members. You use the fishbone diagram with a critical problem because you cannot spend time on every small issue.
Reference: Click Here