
Kanban board provides transparency of work, team capacity, increases efficiency, and helps to visualization of work. Kanban means is a card or virtual signal. Kanban boards in Jira help teams visualize their workflow, limit work-in-progress, and maximize efficiency. Kanban is a method based on the continuous delivery of work, kanban board is designed to help teams continuously improve cycle time and increase efficiency. The Jira Kanban board functions to:
- Promote transparency – Single source of truth helps teams more effectively communicate. Shows where work stands at a glance by displaying the most relevant information for each story, issue, bug, or task.
- Optimize workflows – Visually depict work at various stages. Allow teams to define and configure workflows and can be as simple or as complex as needed.
- Easily spot bottlenecks – Work in progress (WIP) is the number of stories in each status at a time. Establishing WIP limits is vital to prevent bottlenecks so that issues flow smoothly through your workflow.
- Continuously improve – Provide real-time visual metrics to track cycle time and spot workflow blockages using the cumulative flow diagram.
Components of Kanban Board
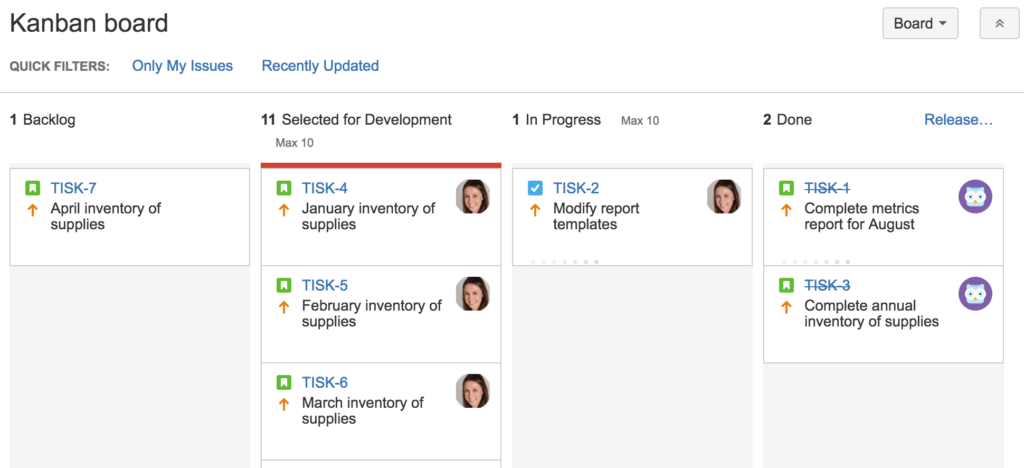
Kanban Visual Signal or Cards – VisualCards contain tasks, bugs, or user stories. These visual signals help teammates and stakeholders quickly understand what the team is working on & the entire workflow.
Kanban Columns/Workflows – Columns showcase a specific activity, and together they represent the entire ‘workflow’. A typical workflow may consist of “To Do,” “In Progress,” “Complete,” and others.
Work-in-Progress Limits – WIP limits are the maximum number of issues that can be in one column or step a workflow at any given time. If the column is having maximum issues then the team needs to swarm on those issues and move them forward before new issues can move into that stage of the workflow. WIP limits are critical for exposing bottlenecks in the workflow and maximizing flow.
Kanban Swimlanes – Kanban Swimlane are horizontal lanes that help in separating different types of activities, Status, teams, stages, and services, etc. Agile teams can easily see issues grouped by different criteria, such as by a user or by issue type.
Delivery point – It is the end of a kanban team’s workflow, typically when the product or service is in the hands of the customer. The team tries to improve their lead time with the goal to move issues from the backlog to the delivery point as fast as possible.
Commitment point/Backlog – Kanban Teams often have a backlog of their Board, where customers and teammates brainstorm for a project. The Commitment Point is a moment when an idea is picked by a team and work begins for the project.
Create Kanban board in JIRA
- Open Jira.
- Click the ellipses, and then click Create Boards.
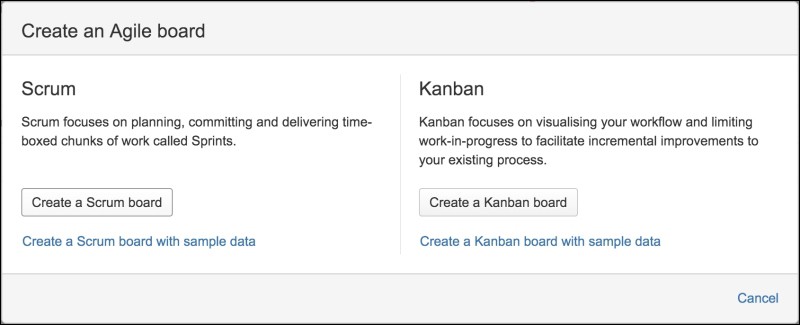
- Click Create a Kanban Board. Click on either Create a board from an existing board or Create a new board from an existing filter.
- Name the board.
- Add one or more projects to the board. Click Create Board.
- The new Jira Kanban board appears with the default columns: Backlog, In Progress, To Do, and Done.
- For details on JIRA Scrum Board Click Here
How to Add or Rename Columns
- On the upper right corner of the Jira screen, click the ellipses.
- Click Board Settings.
- Under Settings, click Column.
- To rename a column, select the name and type the new name.
- To rearrange columns, click anywhere in the top of the column and drag it to a new position.
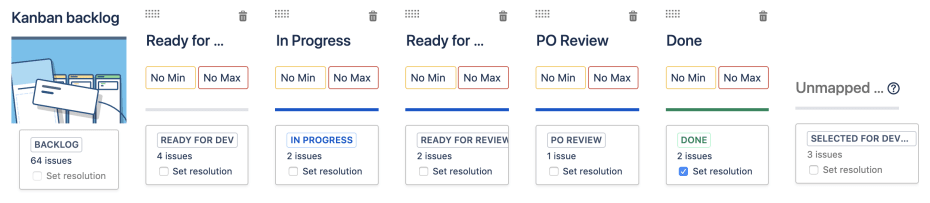
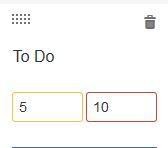
How to Set Minimum and Maximum WIP
- For the column you want to edit, click in the Minimum or Maximum Constraint boxes.
- Type in the numeric limit.
How to Change Card Color and Kanban Board Layout
- On the upper corner of the Jira screen, click the ellipses.
- Click Board Settings.
- Click Card colors.
- Select to apply colors by Issue Type, Priorities, Assignees, or Queries.
- If you want to customize the color, click the Color swatch.
- Click Card layout. You can add up to three extra fields to each card.
Types of Jira Kanban Reports
Jira provides 2 types of Jira Kanban Reports as mentioned below:
Control Chart
The Control Chart shows Cycle Time (or Lead Time) for a product in progress. In this form, Jira Kanban Reports display the time spent on each issue (problem statement) in a Column and map it over a specified period. A Control Chart shows an Average, Rolling Average, and Standard Deviation for a given data.
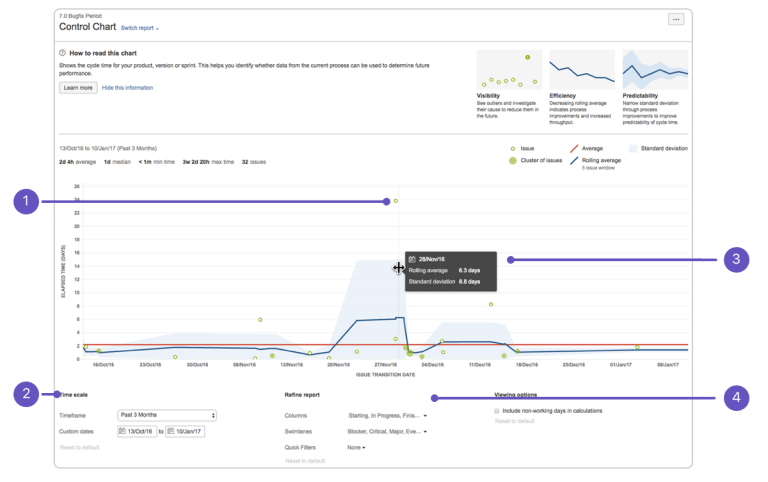
In the Control Chart form, Jira Kanban Reports help Kanban teams in the following ways:
Analyze the team’s past performance.
Measure team’s productivity by the effect of a change in workflow processes.
Provide Stakeholders with visibility of the team’s performance for a running project.
Understand past performance to set benchmarks in workflow for the team.
Steps to Create the Kanban Control Chart
The importance of the Kanban Control Chart with respect to tracking the time utilized in a project was explained in the previous section. Following are the steps to create this form of Jira Kanban Reports:
Step 1: Navigate to your desired Board.
Step 2: Click on Reports, then select the Control Chart.
Step 3: Configure the Chart as desired. The screenshot at the top of this page highlights the Controls one can use to configure the Control Chart.
Cumulative Flow Diagram (CFD)
A Cumulative Flow Diagram (CFD) is an Area Chart displaying the various status of work items for an application. The horizontal axis indicates CFD time, and the vertical axis indicates Cards. The colored area of the Chart represents the workflow status of the Board.
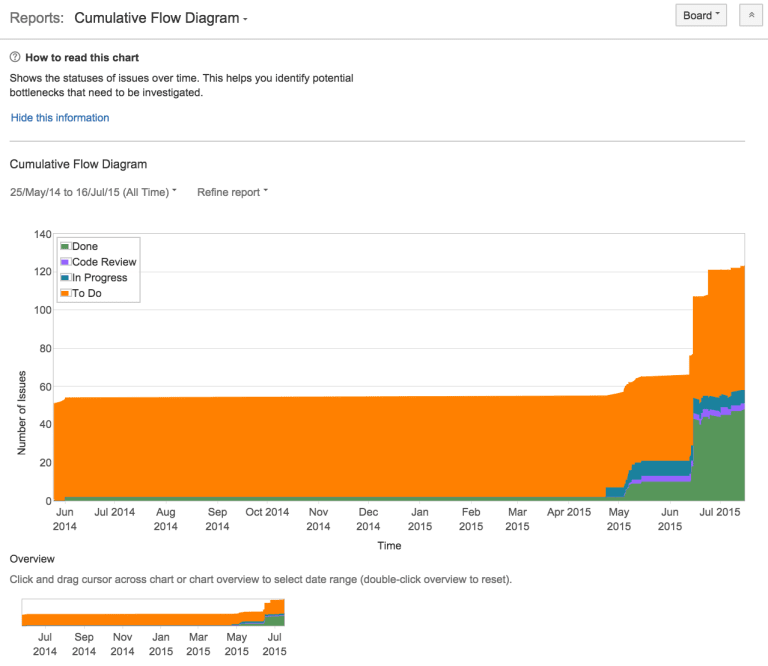
Jira Kanban Reports in the form of CFDs helps Kanban Teams in the following ways:
CFD is Board-specific and includes issues Matching Boards saved filters for any period.
This Chart can help in identifying bottlenecks by observing the widening area of a particular Column.
Steps to Create the Kanban Cumulative Flow Diagram (CFD)
As discussed earlier, the Cumulative Flow Diagram are essential to analyze the work status of a project using different parameters. Following are the steps to create the Kanban Cumulative Flow Diagram:
Step 1: Navigate to your desired Board.
Step 2: Click Reports, then select Cumulative Flow Diagrams and:
- To refine Report data, click Refine Report, and select the desired filters.
- To select a different time frame, click the Date Range drop-down at the top of the Chart.
- To select a different date range, drag the cursor across Overview at the bottom of the Chart.
Recommended Reading
- Scrum Board – Create & Customize for Scrum Team
- Scrum Board – Tips and Tricks for JIRA
- JQL functions – Advanced searching in JIRA
- JIRA Structure – Create & Manage Epics and Stories
- Bulk Jira Issue creation using CSV Template
- JIRA Reports use in tracking Agile Projects
- Issue Analysis Reports use in Agile Projects
- Sprint ID for an Active or Closed Sprint
- Text Field search using advanced search in JIRA