Velocity Chart indicates how many product backlog items have been completed, as per the Definition of Done, during a sprint by the Scrum team. Velocity is a measure of the progress of work executed by the Scrum team. It can be defined as the ‘rate at which Scrum teams consistently delivery product value’. The velocity is a helpful predictive metric that is used to determine how much scope can be delivered by a particular date, or for fixing a date by which a specific amount of scope could be delivered. It helps the team to understand what is possible, and what is not when committing to timelines during a sprint.
The Velocity Chart shows the amount of value delivered in each sprint, enabling you to predict the amount of work the team can get done in future sprints. It is useful during your Sprint Planning meetings, to help you decide how much work your team can feasibly commit to.
To view the velocity chart:
- Navigate to your company-managed Jira Software project.
- From your project’s sidebar, select Reports > Velocity Chart.
Velocity Chart – Read and Use
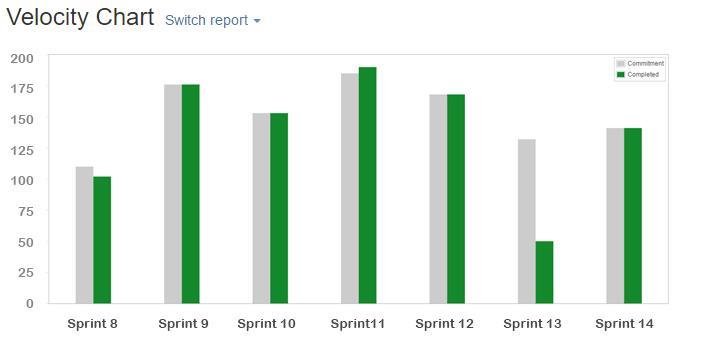
- Estimation statistic: The y-axis displays the statistic used for estimating stories. Estimates can be based on:
- Story points, as shown in the example above
- Original time (minutes, hours, days, or weeks)
- Issue count
- Any numeric custom field in your Jira system.
- Commitment: The gray bar for each sprint shows the total estimate of all issues in the sprint when it begins. After the sprint has started, any stories added to the sprint, or any changes made to estimates, will not be included in this total.
- Completed: The green bar in each sprint shows the total completed estimates when the sprint ends. Any scope changes made after the sprint started are included in this total.
- Sprints: The x-axis displays the last 7 sprints completed by the team. This data is used to calculate velocity.
Other things to note about the Velocity Chart:
- It’s board-specific, which means it’ll only include issues that match your board’s saved filter.
- It’s based on your board’s column mapping. An issue is considered to be ‘To Do’ when it is in a status that has been mapped to the leftmost column of your board. Similarly, an issue is considered to be ‘Done’ when it is in a status that has been mapped to the right-most column of your board.
Team Velocity = Total Story Points Completed Per Sprint / Number of Sprints
Key Terms Associated with Jira Velocity Charts
- Velocity: Velocity refers to the measure of a team’s productivity and its ability to deliver work consistently over time. It is typically measured in story points or other units of estimation.
- Story Points: Story points are a relative measure used in agile software development to estimate the effort required to complete a user story or product backlog item. They represent the complexity, size, and effort needed to implement a particular feature.
- Sprint: A sprint is a time-boxed iteration in which the team plans, develops, and delivers a set of product backlog items. It is a fixed duration, usually ranging from one to four weeks, during which the team works on a defined set of tasks.
- Completed Work: Completed work refers to the amount of work that the team has finished within a sprint or a specific time frame. It is typically represented by the number of story points or backlog items that have been successfully delivered.
- Burndown Chart: A burndown chart is a graphical representation of the remaining work versus time during a sprint or project. It shows the progress of completing the planned work and helps the team track if they are on track to meet their goals.
- Forecasting: Forecasting in Jira velocity charts involves predicting how much work a team can complete in future sprints based on their historical velocity. It helps in setting realistic expectations and planning for future iterations.
- Average Velocity: Average velocity is the average amount of work completed by a team over a certain period. It is calculated by dividing the total number of story points or backlog items completed by the number of sprints or time periods.
- Scope Creep: Scope creep refers to the continuous addition of new requirements or features to a project without proper planning or consideration. Monitoring velocity charts can help identify scope creep and its impact on the team’s ability to deliver work within the planned timeframe.
- Velocity Trend: Velocity trend refers to the pattern or trend observed in a team’s velocity over time. It helps in analyzing the team’s performance, identifying improvement areas, and predicting their capacity for future sprints.
- Velocity Variability: Velocity variability measures the consistency or variability in a team’s velocity. It indicates the stability of the team’s performance and helps in assessing the reliability of their estimates and planning.
- Lead Time: Lead time is the duration between the start and completion of a specific task or user story. Velocity charts can provide insights into the average lead time for different types of work, helping teams understand their workflow efficiency.
- Cycle Time: Cycle time refers to the time taken to complete a single item of work, from start to finish. It helps teams identify bottlenecks, optimize their processes, and improve their overall delivery speed.
Advantages and Disadvantages of Velocity Charts
Advantages:
- It increases stability, reliability, and confidence in Sprint planning. Better predictions can be made about the capabilities and capacity of the team. Using velocity calculations, the number of sprints/iterations can be calculated and the time needed can be roughly determined.
- Whether there are any issues that are hampering progress can be identified, in case the velocity dips significantly.
Disadvantages:
- The velocity is never 100% accurate, as many factors could cause it to fluctuate. If team members drop out or new people join, or there are changes in the scope and requirements, the velocity will be impacted.
- Velocity is subjective and depends on factors like the sprint duration and project size. For this reason, the velocity of two teams on different projects cannot be compared.
- As there is no standard estimation unit of velocity, it becomes difficult to compare velocity as a measure between multiple teams. Senior management may compare one team’s velocity with another to decide the high-performing team.
Tips and Tricks for Velocity Chart
Source of data: Ensure only the tickets which are selected for the sprint contribute to the velocity, and make sure those are worked upon by the team. Any new issues added to the sprint, or change in story points after the sprint starts do not alter the Commitment.
Column Mapping vs Workflow: Tickets on the board at the time of the start of the sprint are considered to contribute to the Commitment. But only tickets that end up on the rightmost column at the end of the sprint will add to Actual velocity. So make sure to map the statuses to columns carefully. It’s not the workflow that matters, but the column mapping.
Issue Hierarchy: JIRA doesn’t handle the issue hierarchy well and will end up double-counting the story points if updated on both Parent and child, except if the child happens to be a Sub-Task.
At the start of Sprint
Tickets without estimates: If the tickets are without an estimate then Zero story point is considered. Any afterward change in the estimate will be captured as “Scope Change” and the revised estimate will only be counted towards Actual.
Completed Tickets on board: Any ticket, which is already mapped to the rightmost column of the board, will contribute to Commitment, but not to Actual. So pay attention to the tickets which are mapped to the rightmost column of the board.
Carried over Tickets: Tickets carried over from sprint to sprint without any change will contribute to Commitments on both sprints. If you want to move tickets from the current to the next sprint then reduce the estimates on carried-over tickets to reflect the outstanding work before starting the next sprint.
After Sprint Start
Estimates updated after sprint start: Updated estimates will be used when calculating Actual Velocity but have no effect on Commitment.
Tickets added after sprint start: These will not contribute to the Commitment, they will contribute to Actual velocity.
Tickets removed after sprint start: These will still contribute to Commitment but not to the Actual velocity.
Tickets removed before sprint closure: These will not contribute to the Actual Velocity even if the tickets were completed within the sprint. It will, however, will be counted towards Commitment.
Stabilize and Improve velocity
To stabilize and improve velocity, consider the following:
- Write user stories that are clear, simple to read, and easy to understand. Maintain collective team accountability, visibility is key.
- Keep team membership and size as consistent as much as possible.
- Make sure all events specifically the Daily Scrum meeting are done with high energy and commitment by the tram & it should be direct and productive. Don’t skip any scrum events.
- Use your sprint retrospectives to explore ways to stabilize velocity. For example, find ways to improve communication and coordinate the work to complete tasks on time.
- Eliminate dependencies that can delay work that the team has committed to complete.
- Develop a better definition of “done.” Look at the tasks that are completed during a stabilization sprint and ask how you could have completed the task during the normal sprint.
- Focus on quality instead of speed. Don’t rush through work to meet an estimate. The sprint velocity should not be the team’s goal. Taking time to develop quality products that are thoroughly tested will give you a better velocity estimate going forward.
- Make sure there is enough time for proper testing to ensure that you are delivering quality products. Also, make sure you are not spending time on unnecessary tests. For example, if the code hasn’t changed and has been stable for several sprints, don’t waste time testing it again.
- Get help when needed. If your team is short on the skills needed to complete certain tasks, recruit inside or outside help.
- Make sure everybody is trained. As new technologies are added to your products, some team members may fall behind. Help team members stay up to speed by offering training to improve skill sets.
Conclusion
Velocity charts in JIRA serve as a valuable tool for agile teams to measure and track their performance, improve planning, and make data-driven decisions. By harnessing the power of velocity charts, teams can enhance their productivity, optimize their delivery process, and continuously improve their overall performance. Understanding how to interpret and utilize velocity charts effectively can empower teams to achieve their goals and deliver high-value software projects.
Recommended Reading
- Scrum Board – Create & Customize for Scrum Team
- Kanban Board – Create & Customize for Kanban Team
- Scrum Board – Tips and Tricks for JIRA
- JQL functions – Advanced searching in JIRA
- JIRA Structure – Create & Manage Epics and Stories
- Bulk Jira Issue creation using CSV Template
- Issue Analysis Reports use in Agile Projects
- Sprint ID for an Active or Closed Sprint
- Text Field search using advanced search in JIRA
- JIRA Reports use in tracking Agile Projects
JIRA Reference: Click Here